Situation overview
The home screen sums up the state of the network at a glance: status, quick access, notes, new CVE matches and live metrics. The quick access is dynamic — it moves the functions the user opens most often to the front, with no configuration at all.
Network scan
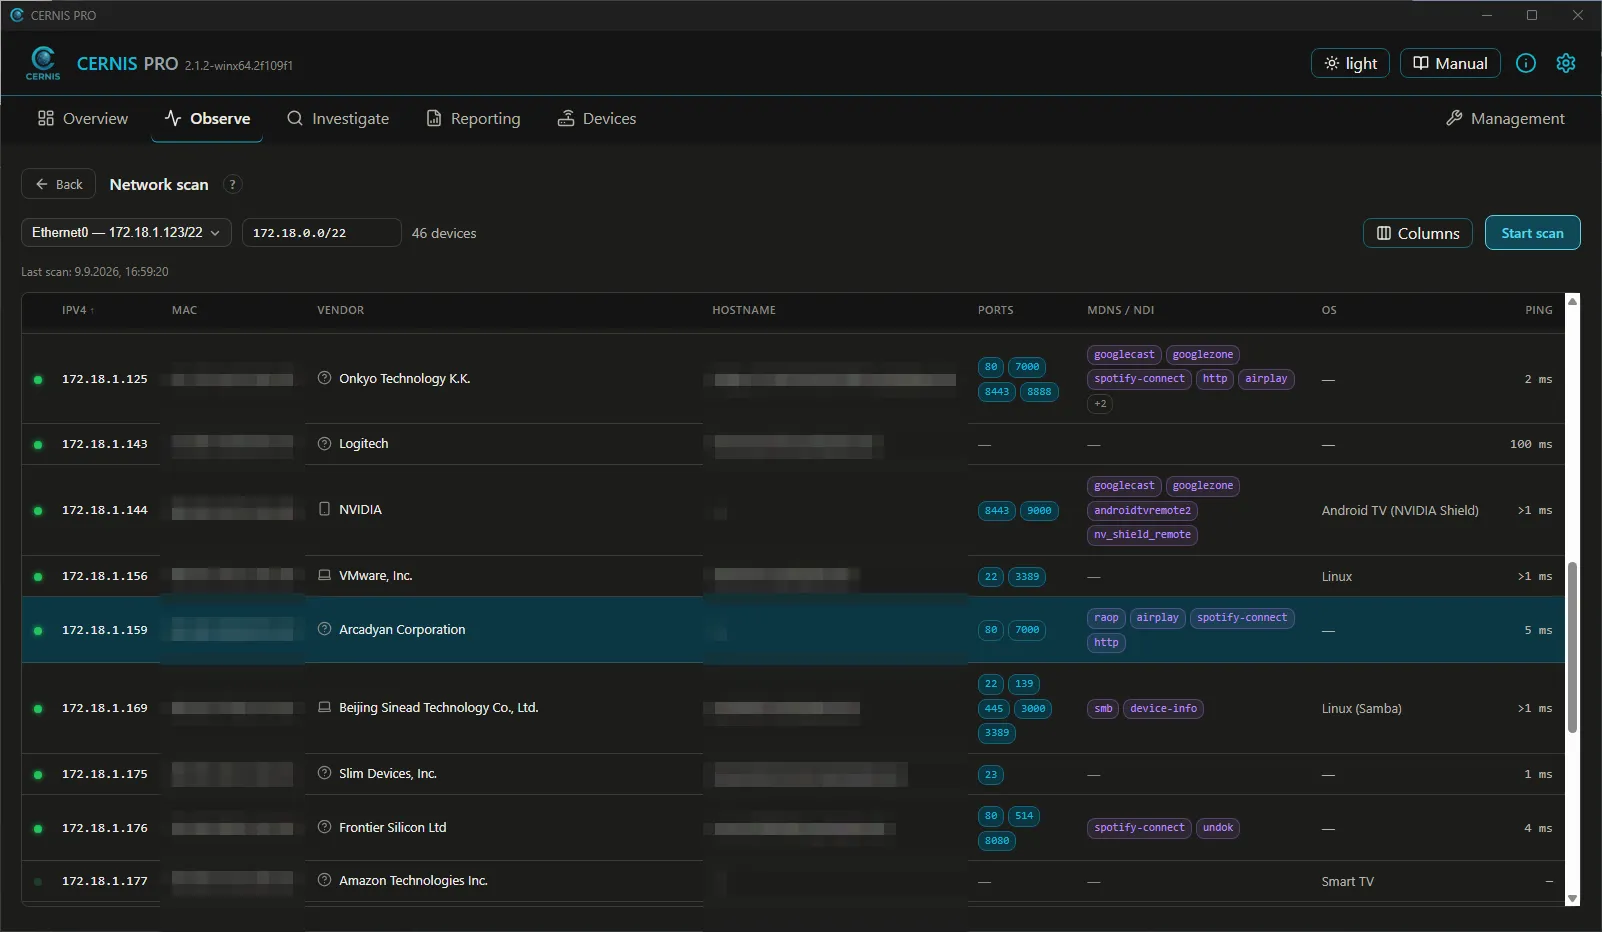
The heart of it: a scan searches the network for active devices, finds open ports and detects services and operating systems. Progress appears live. The result is a clear table — IP, MAC, vendor, host name, open ports, OS and response time for every device.
Facts and judgement kept apart
CERNIS cleanly separates facts (new, changed, new port) from judgements (unusual, critical). Both kinds of marking stay separate, so it is clear at once what has changed and how to weigh it — without one drowning out the other.
Acknowledge findings
A port the user has checked and found harmless can be acknowledged. It disappears from the active warning but stays traceably logged. So no permanent warnings pile up, and the user’s assessments are not lost.
Device detail view
For every device: whether it is known, new or changed, which ports are open, how it fits into the network. It can be classified (trusted / neutral / watch) and annotated with the user’s own notes.
Topology graph
The network as a star-shaped picture: the gateway at the centre, devices around it. Solid lines are actually measured (via LLDP/CDP), dashed ones sensibly assumed. Show either just the devices from the last scan or every device ever known.
Traffic per app
Shows which programs currently have connections to the network and how much data is flowing — organised by the application causing it. Updates run automatically or on demand, exactly as the user prefers.
Names instead of IP addresses
On request, CERNIS resolves the bare IP addresses of remote peers into readable names — only on request, loaded in the background.
Requested host names (SNI)
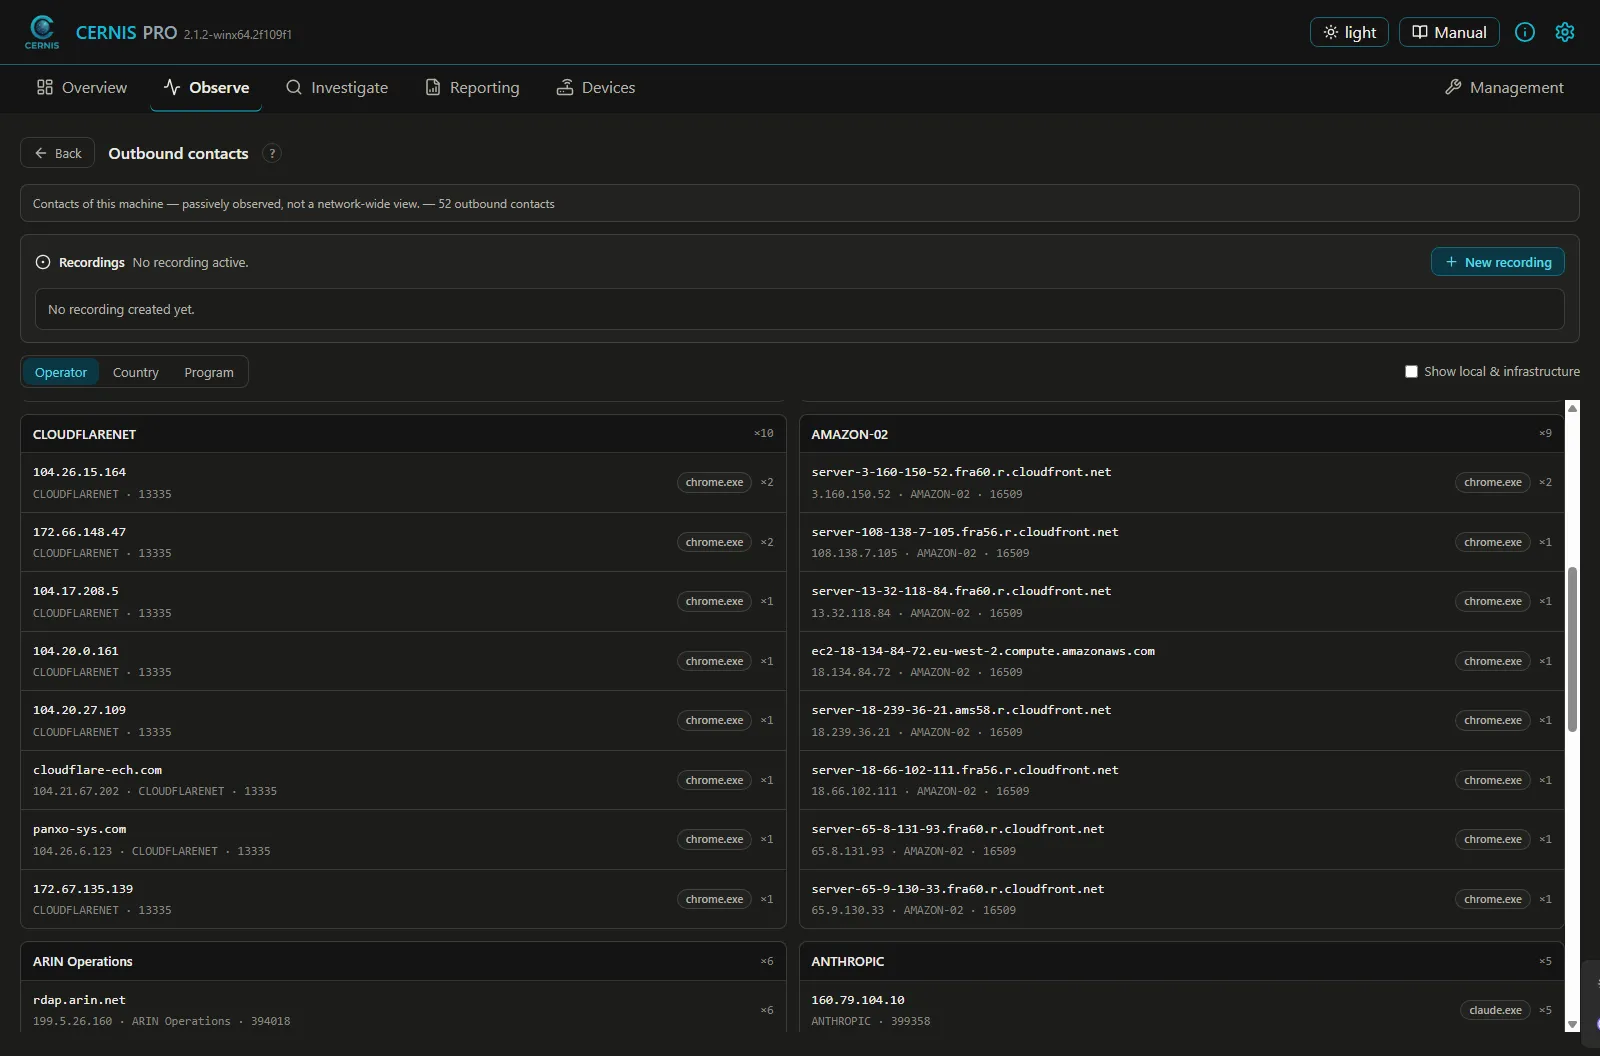
Passively captures which internet addresses the user’s programs contact — even over encrypted connections — and attributes them to the program responsible. It is visible where an app is talking without touching the content. The live data stays transient and disappears again. Anyone who wants to keep the host names derived from it switches on the recording of external contacts.
Process view
Lists running programs with their path and quietly points out when a program may be disguising itself as something else — a subtle but important hint at something unusual.
FRITZ!Box detail view
For anyone using a FRITZ!Box, the official TR-064 interface provides a rich detail view: connection data, DSL values, WLAN clients, the event log and configured port forwardings — all in one place, without clicking through the router menu.
Network interfaces
Shows the machine’s network interfaces with their actual status and highlights the ones carrying the main traffic.
Live monitoring
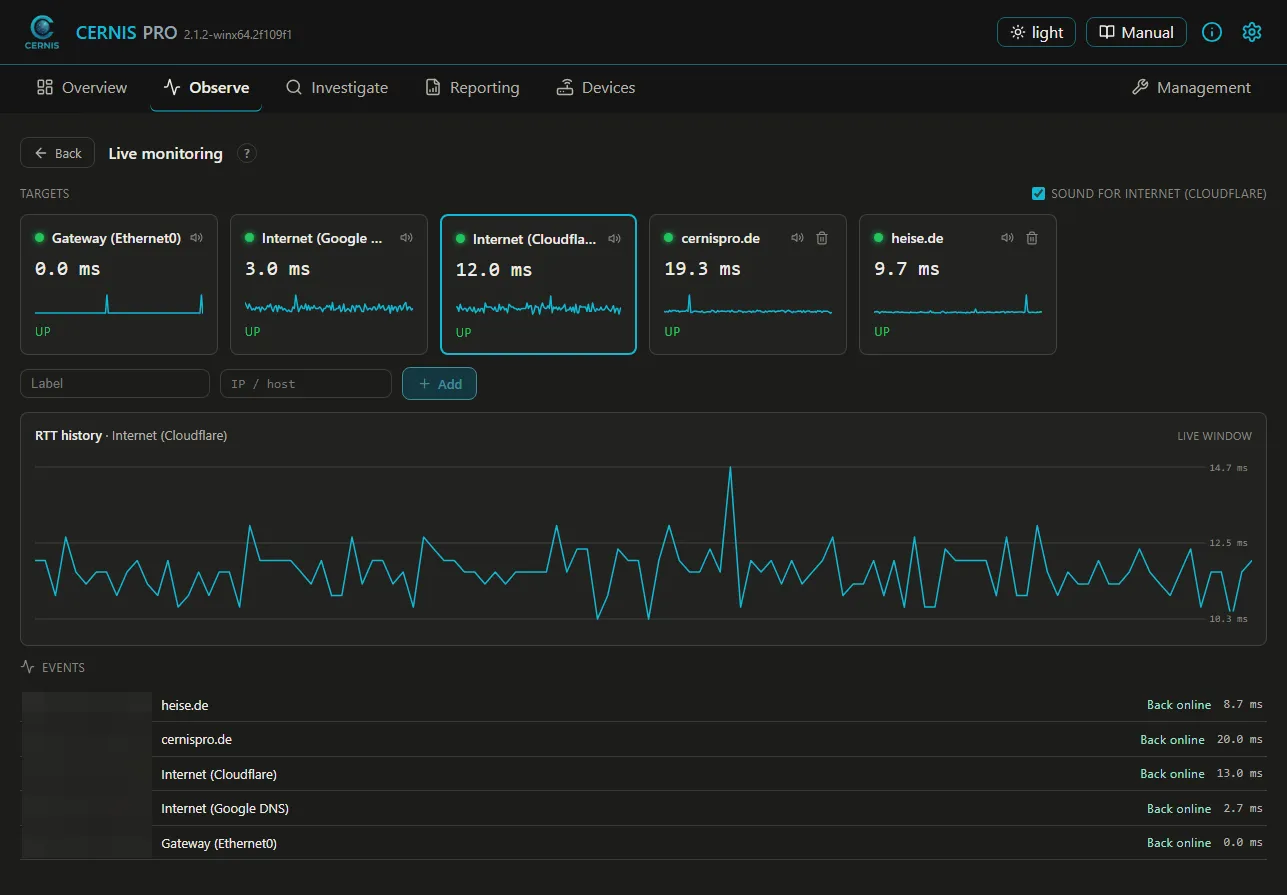
Continuously watches the reachability and response time of the detected gateways and of two preset internet references — Google Public DNS (8.8.8.8) and Cloudflare DNS (1.1.1.1) — and shows outages immediately, with a live chart and an optional audible signal. To do so, CERNIS sends its own check requests to those targets at short intervals. Users can add their own targets.
Long-term recording
Records the reachability of a target over a chosen period, permanently. It runs only when deliberately set up and survives a restart — ideal for pinning down sporadic dropouts over hours or days.
Threshold alarms
A recording can raise an alert when a target becomes too slow or fails. The condition must hold several times in a row — no false alarm from a single outlier.